Meter Log & History
Track and analyze your meter session data with detailed logging and filtering capabilities
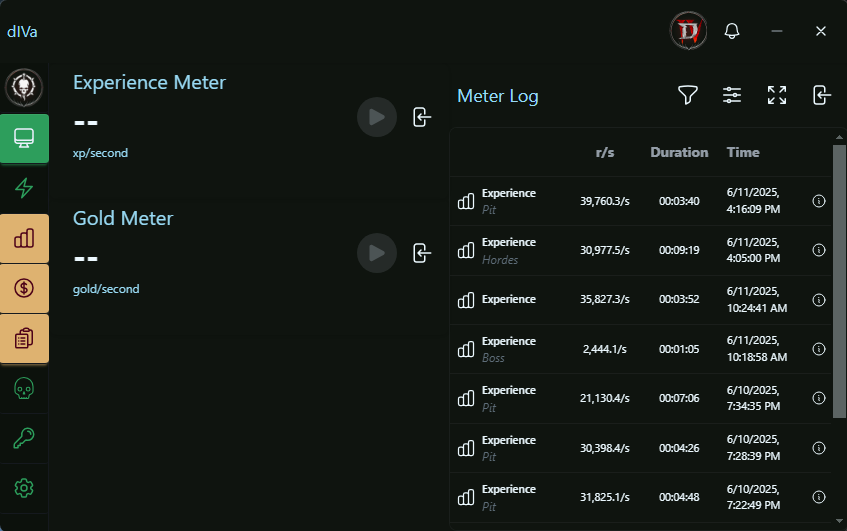
Meter Log Features
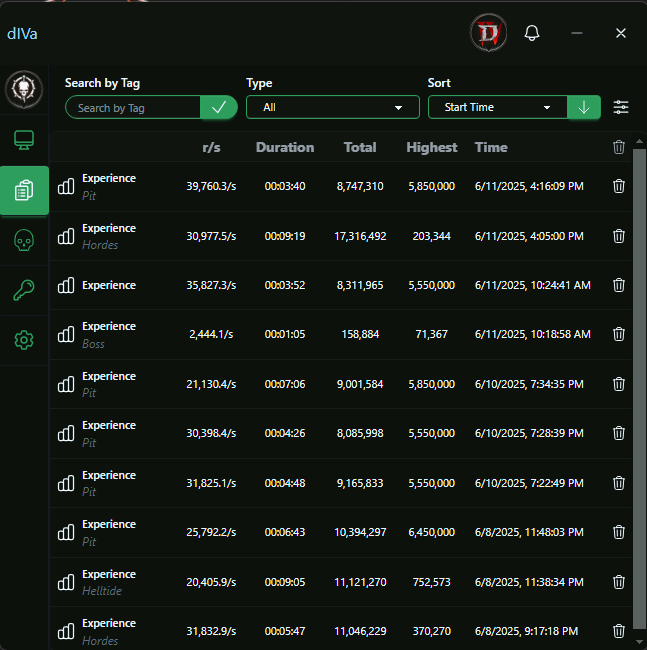
- Session History: View all your meter sessions with detailed statistics including averages, duration, and timestamps.
- Date Range Filtering: Filter sessions by specific date ranges for precise historical analysis and targeted data exploration.
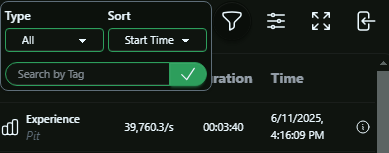
- Type Filtering: Filter sessions by meter type (Gold, Experience, etc.) to focus on specific data.
- Sorting Options: Sort sessions by start time or average resource rate per second (r/s).
- Tag System: Add custom tags to sessions for better organization and quick filtering.
- Quick Tag Search: Search sessions by Tag.
- Timestamp Display: Toggle timestamp visibility, this is useful for when you just want to see the relevent data.
- Total Meter Sessions Counter: Real-time display of total session count for better progress tracking.
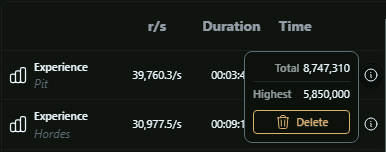
- Session Management: Delete individual sessions to keep your log clean and organized.
- Session Details: Click the info button at the end of any row to view detailed session information in a popover including total amount, highest single gain, and delete option.
Controls
Navigation Bar

- Filtering and Sorting
- Expand to History - Opens full history view with extended functionality
- Access Settings and configuration options
- Close the meter log window
Filter & Sort
- Filter by date range for precise historical analysis
- Filter by meter type (Gold/Experience)
- Sort by start time or average rate
- Search sessions by custom tags
- Clear all filters with one click
Tagging System
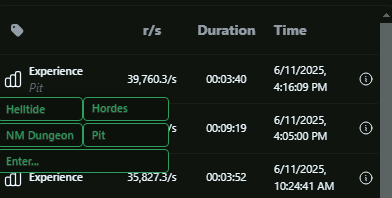
- Quick tag application and management
- Add custom tags to sessions for organization
- Pins last used quick tag for auto-tagging consecutive sessions
Settings & Customization
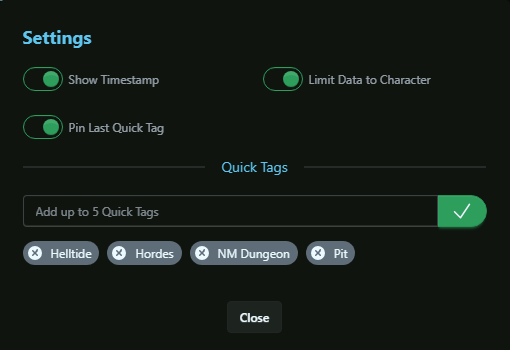
- Show Timestamp: Toggle showing/hiding timestamp columns for cleaner view.
- Limit Data to Character: Filter sessions for current active Character when enabled.
- Pin Last Quick Tag: Pin your last used Tags for automatic tagging of consecutive sessions.
History View & Data Insights
History View - Collapsed Date Range
Date Range filter is collapsed, showing calendar icon
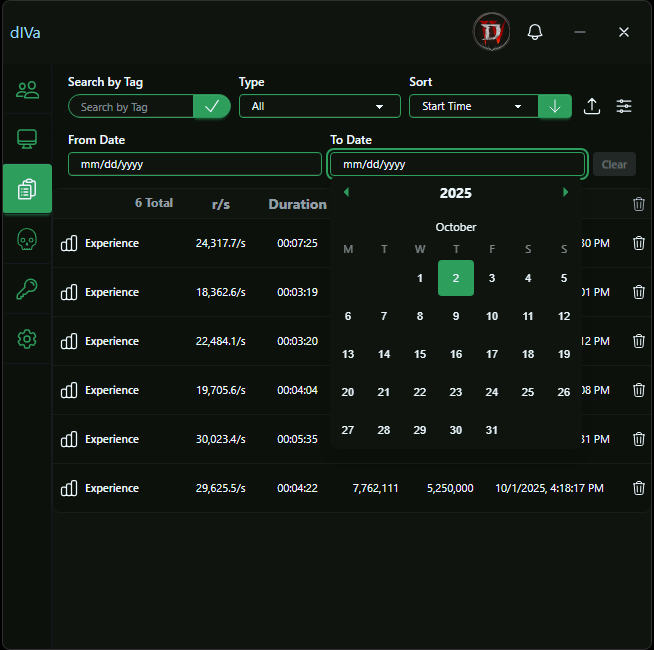
History View - Expanded Date Range
Date Range filter is expanded, showing up arrow to collapse
History View is available by clicking the Expand to History button on the Meter Log, or by clicking the
History button on the Menu (if you are not on the Dashboard).
It is a more comprehensive view of your farming sessions - it allows you to see more data and sort it in a more detailed way.
Collapsible Date Range Filter
The Date Range Filter is a new collapsible section in the History filter menu that provides advanced date-based filtering capabilities:
- Toggle Button: Click the calendar icon to expand the date range filter section
- Calendar Interface: When expanded, shows interactive calendar widgets for selecting start and end dates
- Collapse Button: Click the up arrow icon to collapse the date range section back to a compact view
- Individual Date Clearing: Each date field has its own clear button for quick reset
- Clear All Dates: Use the "Clear" button to reset both from and to dates simultaneously
- Persistent Settings: Your date range preferences are remembered across sessions for consistent filtering
Enhanced Table Display
- Expanded Columns: Total and Highest values shown directly in table (no popover needed)
- Larger Dataset: Display up to 50 sessions per page vs 25 in Meter Log
- Advanced Sorting: Sort by Total amount in addition to start time and average rate
- Sort Direction Toggle: Ascending/descending order control with visual indicators
Bulk Operations
- Delete Filtered: Remove all sessions matching current filter criteria
- Delete All: Complete session history cleanup with confirmation
- Bulk Management: Efficient cleanup for large datasets
- Smart Confirmation: Safety prompts prevent accidental data loss
Enhanced Filtering
- Horizontal Filter Bar: Always-visible filter controls for quick access
- Date Range Filtering: Advanced date-based filtering for precise historical analysis
- Extended Search: More robust tag and type filtering capabilities
- Character-Specific: Filter sessions by specific character when enabled
- Smart Filter Clearing: Enhanced filter management with improved clearing options
Advanced Navigation
- Real-Time Updates: When coupled with Meter Overlays, latest session stats are displayed as well
- Dynamic Pagination Display: Pagination is displayed based on the number of sessions (50)
- Full Controls: Navigate through many sessions with First/Previous/Next controls
When to Use Each View
Meter Log: Available on the Dashboard as a quick overview of recent sessions, use alongside dashboard Meters while actively farming and checking latest results
History View: Icon on Menu when not on the Dashboard, best used if you prefer to play with Meter Overlays. Perfect for deep analysis, data cleanup, bulk operations, and comprehensive session management